


| World Journal of Nephrology and Urology, ISSN 1927-1239 print, 1927-1247 online, Open Access |
| Article copyright, the authors; Journal compilation copyright, World J Nephrol Urol and Elmer Press Inc |
| Journal website http://www.wjnu.org |
Original Article
Volume 4, Number 2, June 2015, pages 201-206
Relationships of Serum Leptin With Nutrition Status and Insulin Resistance in Non-Diabetic Hemodialysis Patients
Seong Eun Suha, Ji Hyun Songa, Hee Gyeong Kima, Kyung Mi Parka, Yang Hyun Choa, Hyung-Jong Kima, b
aDepartment of Internal Medicine, CHA Bundang Medical Center, CHA University, Seongnam, South Korea
bCorresponding Author: Hyung-Jong Kim, Department of Internal Medicine, CHA Bundang Medical Center, 59 Yatap-ro, Bundang-gu, Seongnam-si,Gyeonggi-do, 463-712, South Korea
Manuscript accepted for publication June 22, 2015
Short title: Leptin and Nutrition Status in Non-DM HD
doi: http://dx.doi.org/10.14740/wjnu217w
| Abstract | ▴Top |
Background: Leptin is known as an adipose-derived peptide hormone that has various physiological effects on energy intake and expenditure, glucose homeostasis, the reproductive and circulatory systems, and weight balance. The first goal of this study was to reveal the difference in the blood leptin depending on obesity. The second goal was to uncover the relationship between leptin and inflammatory markers such as homocysteine and C-reactive protein (CRP). The third goal was to demonstrate the relationship of leptin with a non-diabetic hemodialysis (HD) patient’s nutritional status and insulin resistance.
Methods: This cross-sectional study included 44 patients with end-stage renal failure on HD for more than 6 months who had not been diagnosed with diabetes mellitus. Insulin resistance was assessed using the homeostasis model assessment method of insulin resistance (HOMA-IR). The serum leptin levels were measured using radioimmunometric assay. The serum pre-albumin, albumin insulin, glucose, and CRP were checked by various methods.
Results: Serum leptin has a correlation with factors related to the nutritional status, insulin resistance and inflammation. The bivariate analysis showed that the body mass index (BMI), nPCR, total cholesterol, total protein, albumin, pre-albumin and HOMA-IR were positively correlated with the serum leptin levels, and high-sensitivity C-reactive protein (hsCRP) and tCO2 were negatively correlated with the serum leptin concentrations. The linear regression analysis also showed that the BMI, nPCR, total protein, pre-albumin and HOMA-IR were positively correlated, and tCO2 was negatively correlated with the serum leptin level.
Conclusions: This study showed that obese non-diabetic HD patients have higher serum leptin. It also revealed that patients with a high serum leptin level have increased insulin resistance. Therefore, it could be expected that patients who have an elevated serum lepin level have an elevated cardiovascular risk. In addition, further study is needed for the relationship between inflammation markers and serum leptin level.
Keywords: Leptin; Nutrition; Insulin resistance; Hemodialysis
| Introduction | ▴Top |
The most common cause of death in patients with end-stage renal failure is cardiovascular disease. It appears that the risk of cardiovascular disease in patients with chronic renal disease is 10 - 20 times greater than that in the general population [1]. Even though there are ongoing efforts to eliminate cardiovascular risk factors such as by controlling hypertension and hyperlipidemia and by improving dialysis methods, the mortality rate has not decreased. It was previously reported that obesity, which is a cardiovascular risk factor, is related to insulin resistance and chronic inflammation in patients without renal failure, and that obese patients have a higher incidence of cardiovascular disease and a higher death rate [2, 3].
However, several studies have shown that end-stage renal failure patients with a higher body mass index (BMI) have a lower mortality risk, which is the so-called “obesity paradox” [4-6]. Leptin is known as an adipose tissue-derived hormone that regulates the appetite and the energy balance of the body and controls body weight [7]. It is believed to be secreted more in patients with a higher BMI. It has been reported that patients with a higher amount of body fat have a higher serum leptin level, although it could differ threefold among patients with the same amount of body fat [8]. There have been studies on the role of serum leptin, and there is a report that showed that an extremely elevated serum leptin level may play a role in reducing glucose-stimulated insulin secretion and glucose intolerance in chronic renal failure [9]. Another study demonstrated that leptin is associated with a patient’s nutritional condition, as it seems that serum leptin concentrations decreased in patients with reduced protein intake and a low dry body weight [10]. Moreover, a study revealed that the serum leptin concentration has a beneficial effect on patients with end-stage renal failure, because hemodialysis (HD) patients with an elevated serum leptin level become more sensitive to erythropoietin [11].
However, it has been found that leptin is positively correlated with insulin and TNF-alpha [10, 12]. An increase in the serum leptin concentration is also associated with an elevation in C-reactive protein (CRP). It may indicate that leptin is connected to the inflammatory process. As a result, it is uncertain if the elevation in the plasma leptin level is advantageous or harmful in chronic renal failure patients.
Therefore, this study demonstrates, in non-diabetic patients who are undergoing HD, 1) the difference in the serum leptin concentration depending on the BMI, 2) the relationship between serum leptin and inflammation indicators such as homocysteine and CRP, and 3) the correlation of serum leptin with a patient’s nutrition status and insulin resistance.
| Methods | ▴Top |
Patients and controls
A total of 44 end-stage renal failure patients who had been on HD for more than 6 months and had not been diagnosed with diabetes mellitus were investigated in this cross-sectional research. The institutional review boards approved the study and all patients provided informed consent. Each patient’s height and dry body weight were measured after HD to calculate his/her BMI (kg/m2). The World Health Organization (WHO) classification of BMI for the Asian population was used to categorize 15 patients in the obese patients group (BMI ≥ 25 mg/m2) and 29 patients in the non-obese group (BMI < 25 kg/m2).
The criteria for recruitment were as follows: 1) age > 18 years and 2) at least 6 months of HD therapy. Patients were excluded from this study if they had one of the following conditions: 1) within 3 months, any infection, cardiovascular disease or malignancy; 2) any chronic disease or medication that leads to anorexia, except chronic renal disease; and 3) chronic renal disease secondary to diabetes mellitus.
Blood sampling, measurements and calculations
All the plasma samples of the patients were taken in the morning, after an overnight fast of least 8 h and immediately before the start of their HD. Their blood samples were stored at -70 °C until their analysis. Insulin resistance was assessed using the homeostasis model assessment method of insulin resistance (HOMA-IR) with serum fasting glucose levels and insulin concentrations. It was suggested several times in the previous study that HOMA-IR could be an index of insulin resistance [13, 14]. The HOMA-IR was calculated with the following formula: HOMA-IR = Fasting plasma glucose (mg/dL) × Fasting immunoreactive insulin (mU/L)/405.1 [15]. The serum leptin levels were checked using radioimmunometric assay. The serum pre-albumin concentrations were estimated using the laser nephelometry method, and the serum insulin levels were assessed using radioimmunometric assay (Insulin RIA-BEAD II; Dinabot Co., Tokyo, Japan). The serum glucose concentration was evaluated using the glucose oxidase method, and the serum albumin was checked with the bromocresol green method. The serum CRP level was measured using the high-sensitivity immunoturbidimetric method (hsCRP; Dade Behering, Marburg, Germany).
Statistical analysis
All the technical data were given as the mean ± standard deviation, and the Mann-Whitney U-test was conducted to compare the differences in the continuous variables and the X2 test was used to analyze the non-continuous variables. The correlation of the variables was evaluated using the Spearman correlation coefficient. Linear regression analysis was performed to find the independent variables that have an influence on the serum leptin concentrations. All the statistical data were processed with SPSS 17.0, and a P value that was less than 0.05 was considered statistically significant.
| Results | ▴Top |
Clinical characteristics of the patients
Among the 44 patients in this study, 25 were male and 19 were female, and their mean age was 52.0 ± 16.1 years. The causes of their renal failure were hypertension in 23 patients, chronic glomerulonephritis in 10 patients, polycystic kidney disease in three patients and idiopathic origin in eight patients. The average duration of their HD was 63.7 ± 58.0 months, their mean BMI was 22.8 ± 3.7 kg/m2, their Kt/V was 1.4 ± 0.2 and their nPCR was 0.8 ± 0.2 g/kg/day. The HOMA-IR for the insulin resistance was 6.6 ± 5.2, the homocysteine and hsCRP, as the inflammation markers, were 16.4 ± 4.2 μmol/L and 0.3 ± 0.5 mg/dL, respectively, and the serum leptin concentration was 14.2 ± 19.3 ng/dL (Table 1).
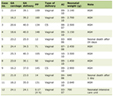 Click to view | Table 1. Characteristics of Study Population |
Clinical characteristics, insulin resistance, inflammatory markers and nutrition status based on the BMI
The insulin resistance, nutrition status, inflammatory markers and serum leptin levels of the obese patients group, which was defined as the group of patients who had a BMI of more than 25 kg/m2, were analyzed and compared with those of the non-obese group. Of the total of 44 patients, the obese patients group consisted of 15 patients whose mean age was 48.6 ± 14.8 years. The reasons for the CRF were hypertension in eight patients, glomerulonephritis in three patients, polycystic kidney disease in one patient and idiopathic disease in three patients. The average duration of the HD in this group was 49.7 ± 40.6 months, their mean BMI was 26.8 ± 2.7, and their Kt/V was 1.2 ± 0.1. The other results are as follows: nPCR, 0.8 ± 0.2 g/kg/day; albumin, 3.8 ± 0.3 mg/dL; pre-albumin, 29.3 ± 8.0 mg/dL; total cholesterol, 133.9 ± 43.6 mg/dL; triglyceride, 134.6 ± 63.9 mg/dL; HDL-cholesterol, 33.6 ± 8.2 mg/dL; LDL-cholesterol, 69.4 ± 17.1 mg/dL; tCO2, 20.4 ± 2.7 mEq/L; hsCRP, 0.2 ± 0.3 mg/dL; HOMA-IR, 7.2 ± 5.1; homocysteine, 16.7 ± 3.4 μmol/L; and leptin, 24.2 ± 26.1 ng/dL. The non-obese group (BMI < 25 mg/m2) included 29 patients whose mean age was 53.7 ± 16.7 years. The reasons for the CRF were hypertension in 15 patients, which was the most common reason, glomerulonephritis in seven patients, polycystic kidney disease in two patients, and idiopathic disease in five patients. The average duration of the HD procedures in this non-obese group was 70.9 ± 64.6 months, BMI was 20.8 ± 2.3, and Kt/V was 1.5 ± 0.1. The other results were as follows: nPCR, 0.8 ± 0.1 g/kg/day; albumin, 3.8 ± 0.4 mg/dL; pre-albumin, 26.0 ± 8.6 mg/dL; total cholesterol, 124.9 ± 33.4 mg/dL; triglyceride, 101.2 ± 66.5 mg/dL; HDL-cholesterol, 37.9 ± 9.3 mg/dL; LDL-cholesterol, 73.0 ± 22.6 mg/dL; tCO2, 20.9 ± 2.9 mEq/L; hsCRP, 0.4 ± 0.6 mg/dL; HOMA-IR, 6.3 ± 5.4; homocysteine, 16.3 ± 4.5 μmol/L; and leptin, 9.0 ± 12.2 ng/dL. In this comparative study of the obese and non-obese groups, the serum leptin level and the BMI significantly increased in the obese group (P < 0.05). On the other hand, the Kt/V significantly rose in the non-obese group (P < 0.05) (Table 2).
Click to view | Table 2. The Correlation Between Leptin and Biochemical Parameters (N = 44) |
Correlation of leptin with the insulin resistance, inflammation factor and nutritional status
In the investigation of the correlation of leptin with factors related to the nutritional status and inflammation, the bivariate analysis showed that the BMI, nPCR, total cholesterol, total protein, albumin, pre-albumin and HOMA-IR were positively correlated with the serum leptin levels, and hsCRP and tCO2 were negatively correlated with the serum leptin concentrations (Table 2). The linear regression analysis showed that the BMI, nPCR, total protein, pre-albumin and HOMA-IR were positively correlated, and tCO2 was negatively correlated with the serum leptin level (Fig. 1). However, the multivariable analysis showed no statistically significant variable, except for the BMI (Table 2).
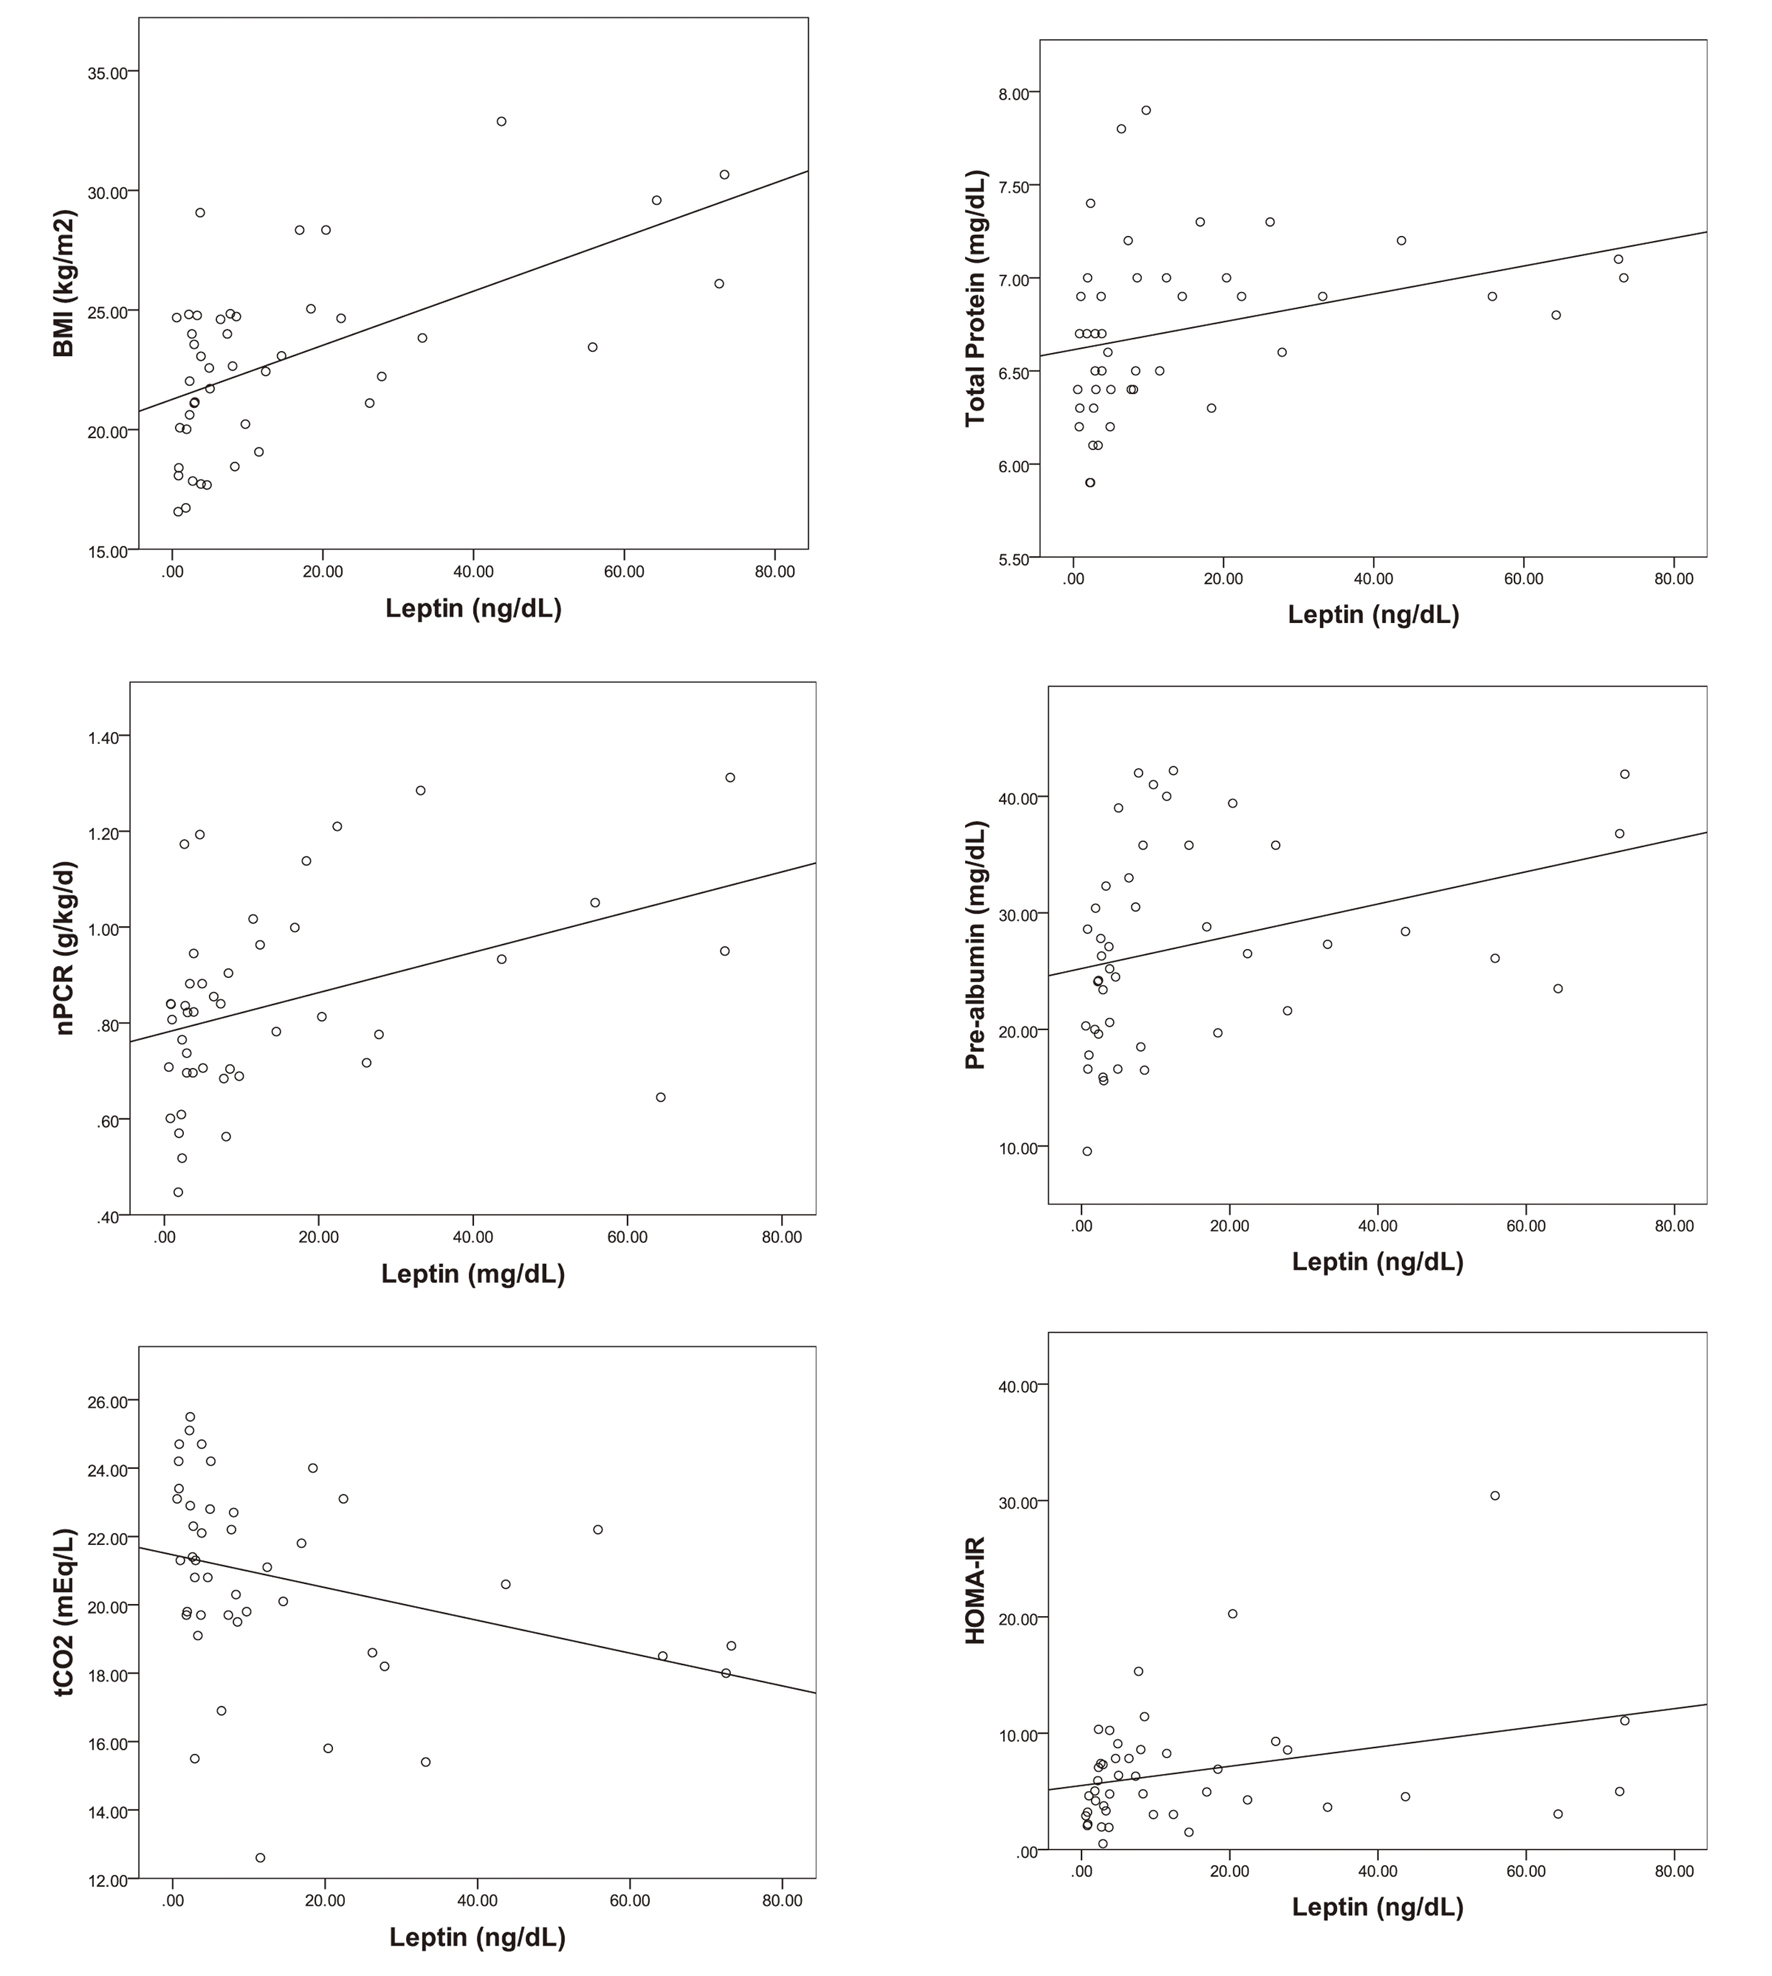 Click for large image | Figure 1. The correlations of serum leptin with BMI, nPCR, tCO2, total protein, pre-albumin and HOMA-IR (P < 0.05). |
| Discussion | ▴Top |
Leptin is a 16-kDa serum protein, which is expressed from the Ob gene. An increased adipose tissue level is known to indicate an elevated level of leptin, and the level of leptin is known to decrease with weight loss [7]. In addition, the serum leptin level in HD patients is higher than that in patients who have a normal kidney function. This result is attributed to the reduced renal excretion of leptin because of the deterioration of the renal excretory function [16, 17]. Moreover, leptin is known to have diverse physiological effects on various organs. It is an important hormone that is related to glucose homeostasis, food ingestion, body weight balance and hematogenous functions, and has an influence on the reproductive and cardiovascular organs. A previous report insisted that hyperleptinemia induced insulin resistance [18].
This study of non-diabetic patients on HD revealed a considerable increase in Kt/V in the non-obese group compared with obese group. Such was deemed to have been because the non-obese patients had a lower body weight, which made their dialysis seem more efficient. The obese patients group also maintained a 1.2 ± 0.1 Kt/V level, as recommended by the US National Kidney Foundation. In addition, the obese patients group had higher levels of serum leptin than the non-obese group, as mentioned in previous studies. Apart from the serum leptin levels, there were no other significantly different parameters between the two groups.
The correlation analysis, or the so-called bivariate analysis, showed that serum leptin was positively correlated with the factors that reflect the nutritional condition of non-diabetic HD patients, such as their total protein, albumin, pre-albumin and nPCR (P < 0.05). This could be explained from two points of view: the first, that the well-nourished patients might have shown an elevated serum leptin level, and the other, that an increase in the serum leptin might have improved the nutritive condition. Moreover, the serum leptin was positively correlated with the total cholesterol, which is one of the lipid profiles. The cholesterol levels in these study groups were not high, and cholesterol levels as well as albumin levels are known to be related to the nutritional status if they are within the normal range. However, in the linear regression analysis, the total protein, pre-albumin and nPCR showed a statistically significant correlation with the leptin levels, but the albumin (P < 0.065) and total cholesterol (P < 0.359) did not.
The tCO2 levels in HD patients indicate blood acidosis, but patients who digest much protein can be expected to have a lower tCO2 level. A previous study on HD patients reported a paradoxically inverse association between mildly decreased serum bicarbonate and improved markers of the protein-energy nutritional state [19-22]. Therefore, patients with a lower tCO2 can be deemed to have a good nutritional condition. In this study, the mean value of tCO2 was 20.4 ± 2.7 mEq/L, which was moderately lower. The leptin and tCO2 showed a negative correlation, and this result supports the possibility that the leptin levels may increase in the well-fed patients.
In the bivariate analysis, which assesses the correlation of leptin with inflammatory markers such as hsCRP and homocysteine, hsCRP and leptin had a negative correlation, but there was no significant relationship between leptin and homocysteine. The linear regression analysis further showed that hsCRP was not significantly related to leptin (P < 0.281).
Insulin resistance is known as an independent predictor of cardiovascular mortality in patients with end-stage renal failure [13, 14]. It appears that leptin has an effect on the insulin sensitivity in the peripheral organs. Non-diabetic patients with an increased serum leptin concentration have been reported to have a higher risk of insulin resistance [23]. In this study, the serum leptin level was compared with the HOMA-IR, which reflects the insulin resistance of the patient according to his/her BMI, but there was no significant difference (data not shown). The bivariate analysis showed a significant positive correlation between the serum leptin concentration and the HOMA-IR. The same result was repeatedly shown in the linear regression analysis. Similar to previous researches, this study supported the hypothesis that an elevation in the serum leptin level is associated with insulin resistance in non-diabetic HD patients. However, it is unclear if leptin itself aggravates the insulin resistance or if hyperleptinemia is merely a reaction to the worsened insulin resistance.
This research had several limitations. First, it had few subjects. Second, the other inflammatory markers such as TNF-alpha and IL-6 were not evaluated. Third, it was a cross-sectional study, so it did not include a follow-up study on the insulin resistance and the inflammatory markers. Fourth, it did not analyze the mortality and morbidity of the patients, so it did not reveal if leptin is related to the prognosis of non-diabetic patients with end-stage renal failure. Therefore, a further study is required to reveal the exact relationship between leptin, inflammation and insulin resistance.
Leptin is positively correlated with a non-diabetic HD patient’s nutrition status. Among well-nourished patients who have increased serum leptin levels and an elevated amount of fat components, leptin is considered related to insulin resistance. It may play a role in the risk factor for cardiovascular morbidity and mortality. Therefore, we may use serum leptin level to guess the insulin resistance of non-diabetic HD patients. Also it could be used as cardiovascular risk factor.
Conflict of Interest
The authors declare no conflict of interest.
| References | ▴Top |
- Foley RN, Parfrey PS, Sarnak MJ. Epidemiology of cardiovascular disease in chronic renal disease. J Am Soc Nephrol. 1998;9(12 Suppl):S16-23.
doi - Gomez-Ambrosi J, Salvador J, Paramo JA, Orbe J, de Irala J, Diez-Caballero A, Gil MJ, et al. Involvement of leptin in the association between percentage of body fat and cardiovascular risk factors. Clin Biochem. 2002;35(4):315-320.
doi - Hubert HB, Feinleib M, McNamara PM, Castelli WP. Obesity as an independent risk factor for cardiovascular disease: a 26-year follow-up of participants in the Framingham Heart Study. Circulation. 1983;67(5):968-977.
doi pubmed - Leavey SF, McCullough K, Hecking E, Goodkin D, Port FK, Young EW. Body mass index and mortality in 'healthier' as compared with 'sicker' haemodialysis patients: results from the Dialysis Outcomes and Practice Patterns Study (DOPPS). Nephrol Dial Transplant. 2001;16(12):2386-2394.
doi pubmed - Wolfe RA, Ashby VB, Daugirdas JT, Agodoa LY, Jones CA, Port FK. Body size, dose of hemodialysis, and mortality. Am J Kidney Dis. 2000;35(1):80-88.
doi - Johnson DW, Herzig KA, Purdie DM, Chang W, Brown AM, Rigby RJ, Campbell SB, et al. Is obesity a favorable prognostic factor in peritoneal dialysis patients? Perit Dial Int. 2000;20(6):715-721.
pubmed - Friedman JM, Halaas JL. Leptin and the regulation of body weight in mammals. Nature. 1998;395(6704):763-770.
doi pubmed - Licinio J, Negrao AB, Mantzoros C, Kaklamani V, Wong ML, Bongiorno PB, Negro PP, et al. Sex differences in circulating human leptin pulse amplitude: clinical implications. J Clin Endocrinol Metab. 1998;83(11):4140-4147.
doi - Stenvinkel P, Heimburger O, Lonnqvist F. Serum leptin concentrations correlate to plasma insulin concentrations independent of body fat content in chronic renal failure. Nephrol Dial Transplant. 1997;12(7):1321-1325.
doi pubmed - Nishizawa Y, Shoji T, Tanaka S, Yamashita M, Morita A, Emoto M, Tabata T, et al. Plasma leptin level and its relationship with body composition in hemodialysis patients. Am J Kidney Dis. 1998;31(4):655-661.
doi pubmed - Axelsson J, Qureshi AR, Heimburger O, Lindholm B, Stenvinkel P, Barany P. Body fat mass and serum leptin levels influence epoetin sensitivity in patients with ESRD. Am J Kidney Dis. 2005;46(4):628-634.
doi pubmed - Heimburger O, Wang T, Lonnqvist F, Stenvinkel P. Peritoneal clearance of leptin in CAPD patients: impact of local insulin administration. Nephrol Dial Transplant. 1999;14(3):723-727.
doi pubmed - Shinohara K, Shoji T, Emoto M, Tahara H, Koyama H, Ishimura E, Miki T, et al. Insulin resistance as an independent predictor of cardiovascular mortality in patients with end-stage renal disease. J Am Soc Nephrol. 2002;13(7):1894-1900.
doi pubmed - Mustata S, Chan C, Lai V, Miller JA. Impact of an exercise program on arterial stiffness and insulin resistance in hemodialysis patients. J Am Soc Nephrol. 2004;15(10):2713-2718.
doi pubmed - Yokoyama H, Emoto M, Fujiwara S, Motoyama K, Morioka T, Komatsu M, Tahara H, et al. Quantitative insulin sensitivity check index and the reciprocal index of homeostasis model assessment in normal range weight and moderately obese type 2 diabetic patients. Diabetes Care. 2003;26(8):2426-2432.
doi pubmed - Johansen KL, Mulligan K, Tai V, Schambelan M. Leptin, body composition, and indices of malnutrition in patients on dialysis. J Am Soc Nephrol. 1998;9(6):1080-1084.
pubmed - Stenvinkel P, Lindholm B, Lonnqvist F, Katzarski K, Heimburger O. Increases in serum leptin levels during peritoneal dialysis are associated with inflammation and a decrease in lean body mass. J Am Soc Nephrol. 2000;11(7):1303-1309.
pubmed - Mallamaci F, Tripepi G, Zoccali C. Leptin in end stage renal disease (ESRD): a link between fat mass, bone and the cardiovascular system. J Nephrol. 2005;18(4):464-468.
pubmed - Lin SH, Lin YF, Chin HM, Wu CC. Must metabolic acidosis be associated with malnutrition in haemodialysed patients? Nephrol Dial Transplant. 2002;17(11):2006-2010.
doi pubmed - Gao H, Lew SQ, Bosch JP. Moderate metabolic acidosis and its effects on serum parameters in hemodialysis patients. Nephron. 2000;86(2):135-138.
doi pubmed - Leavey SF, Strawderman RL, Young EW, Saran R, Roys E, Agodoa LY, Wolfe RA, et al. Cross-sectional and longitudinal predictors of serum albumin in hemodialysis patients. Kidney Int. 2000;58(5):2119-2128.
doi pubmed - Chauveau P, Fouque D, Combe C, Laville M, Canaud B, Azar R, Cano N, et al. Acidosis and nutritional status in hemodialyzed patients. French Study Group for Nutrition in Dialysis. Semin Dial. 2000;13(4):241-246.
doi pubmed - Zoccali C, Tripepi G, Cambareri F, Catalano F, Finocchiaro P, Cutrupi S, Pizzini P, et al. Adipose tissue cytokines, insulin sensitivity, inflammation, and cardiovascular outcomes in end-stage renal disease patients. J Ren Nutr. 2005;15(1):125-130.
doi pubmed
This is an open-access article distributed under the terms of the Creative Commons Attribution License, which permits unrestricted use, distribution, and reproduction in any medium, provided the original work is properly cited.
World Journal of Nephrology and Urology is published by Elmer Press Inc.